Running in Brooklyn
Inspired by Paul Oster's City of Glass and Joseph D. Terwilliger's How I Walked Every Block in Manhattan in 10 Weeks, in the summer of 2014 I started playing with the GPS trajectory data from my iPhone.
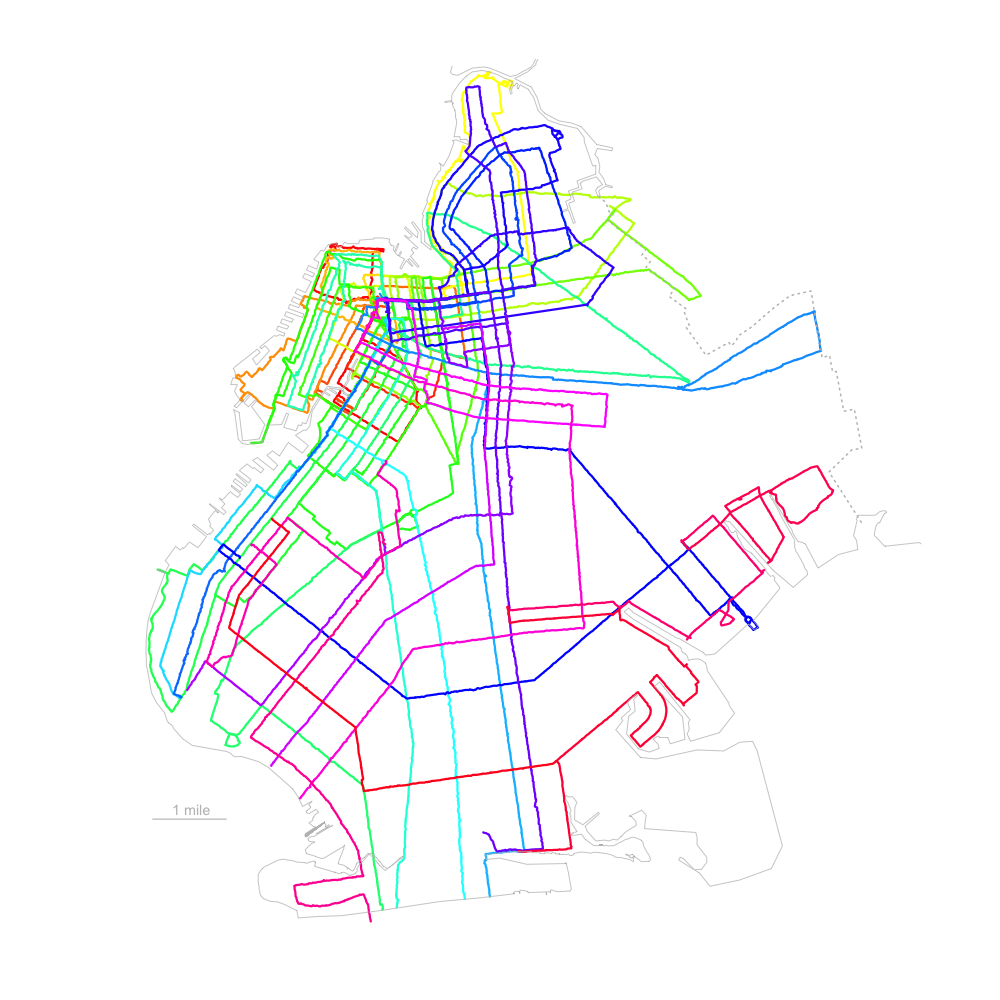
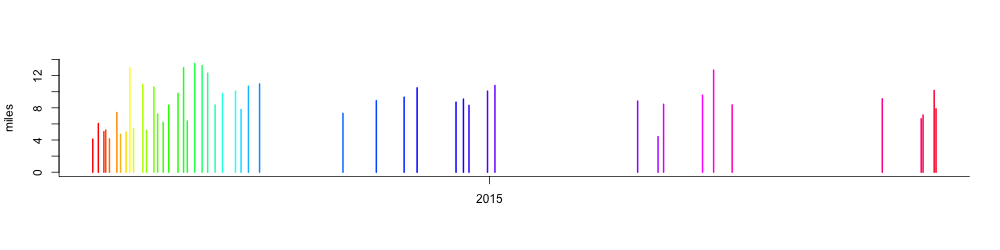
I like the intrinsic richness of geodata and how it automatically relates to everyday experiences, unlike the more abstract computational biology data I normally work with. For example, my routes color-coded by height start to piece together the underlying geography of Brooklyn
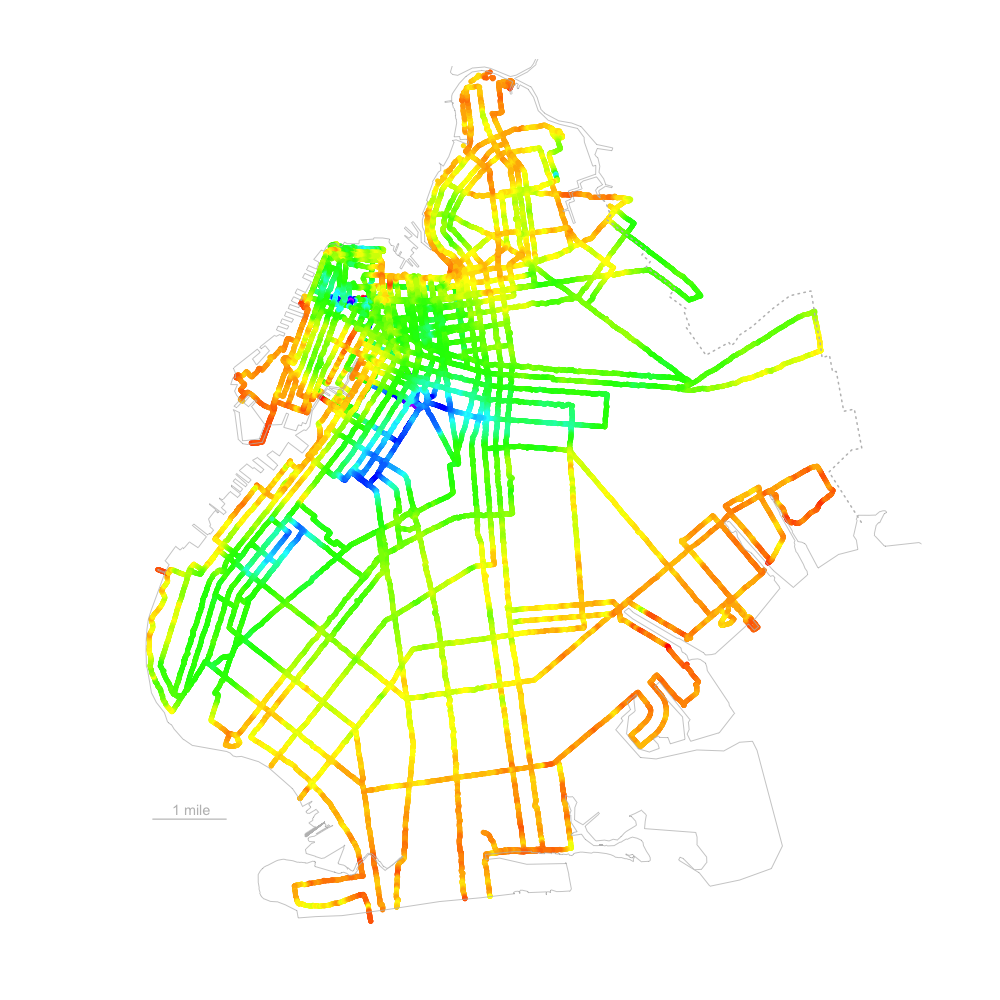
and explain some of the unusual angles in the Brooklyn street grid. This map reminds me of another indirect way to infer geography via the New York City hurricane zoning map.
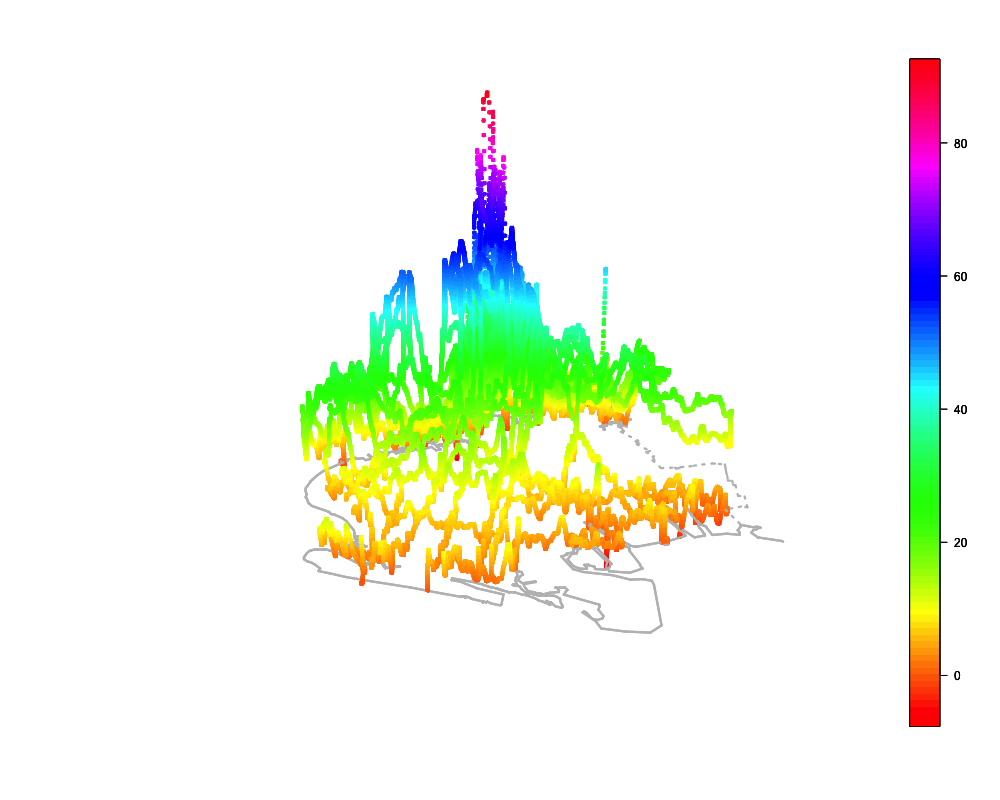
The iPhone GPS is not very precise, a fact less visible when your coordinates are a
couple of meters off on a kilometer-long trajectory, but rather obvious on an ~80m
height scale. So some smoothing will be in order, when I have the time.
And when I finally got the hang of it, I moved to San Francisco. But I kept on running.
Details:
Drawn in R based on geodata captured by Runtastic app for iPhone. To be consistent with on-line map services, the projection is approximately Mercator (aspect ratio 1.305 at 40°40′ latitude).